
The stock market can be a realm of both opportunity and chaos. For those prepared to navigate its unpredictable waves, one strategy stands out for its promise of profit: breakout trading. Whether you’re an experienced trader or just dipping your toes into the world of stock investment, understanding how to effectively trade breakouts can be your ticket to capitalizing on market movements. In this article, we will explore the nuances of breakout trading specifically in the context of the Indian stock market, equipping you with the tools and knowledge necessary to make informed trading decisions.
Understanding Breakouts in Trading
Definition of Breakouts
At its core, a breakout refers to a significant price movement that occurs when an asset breaks through a defined level of support or resistance. This can lead to increased volatility and volume, presenting traders with potential profit opportunities. In simpler terms, when a stock price exits a previously established range – either upwards or downwards – it’s said to have broken out. Breakouts often signal the initiation of a new trend, which traders’ keenly watch to enter at the right time.
Types of Breakouts
In breakout trading, traders typically refer to two types of breakouts:
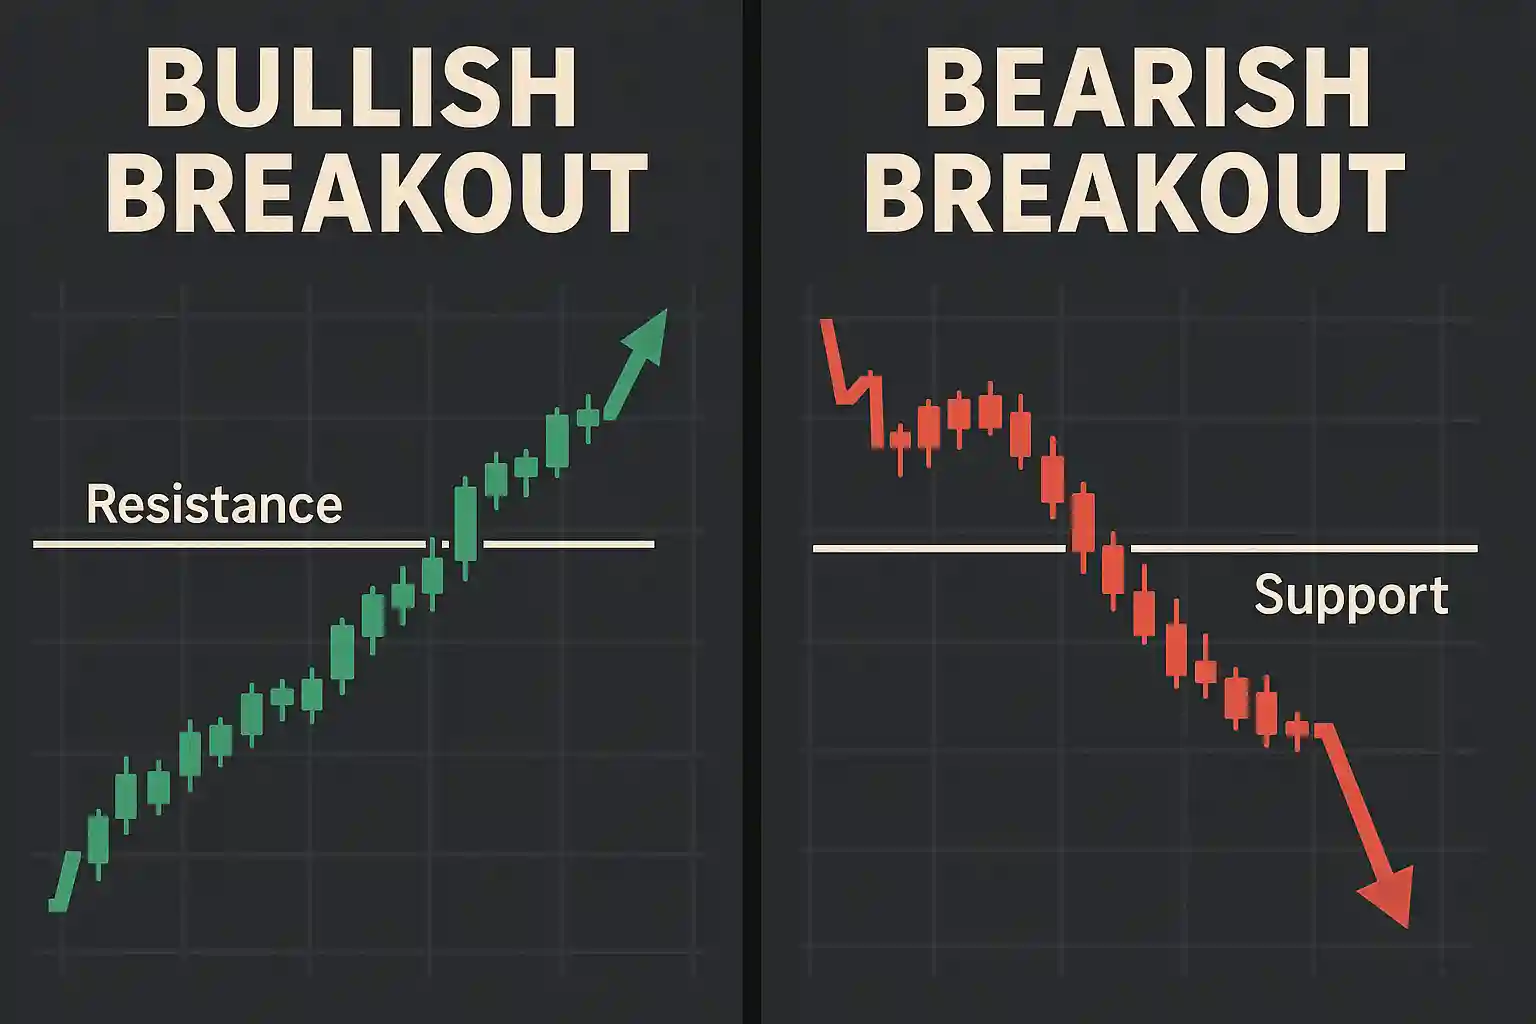
- Bullish Breakouts: A bullish breakout occurs when the price moves above resistance levels, suggesting the potential for a significant price increase. This indicator is generally considered a buy signal. For instance, if a stock like Reliance Industries Limited consistently struggles to rise above ₹1,350, the moment it surges past this price mark with a spike in volume, it may indicate investors are increasingly bullish, prompting new buying interest.
- Bearish Breakouts: Conversely, a bearish breakout happens when the price falls below a support level. This often signals a downward price trend and is interpreted as a sell signal. For example, if a stock like Infosys breaks below ₹1,375, it could indicate a potential downward trend, prompting traders to either sell their positions or short the stock.
Understanding these types of breakouts is crucial as they lay the foundation for identifying profitable trading opportunities.
Identifying Breakout Opportunities
The first step in successful breakout trading is to identify where these breakouts may occur. This requires a combination of technical analysis, chart patterns, and an awareness of market conditions.
Using Technical Indicators
Technical indicators can be powerful tools for spotting breakout opportunities. Some of the most effective include:
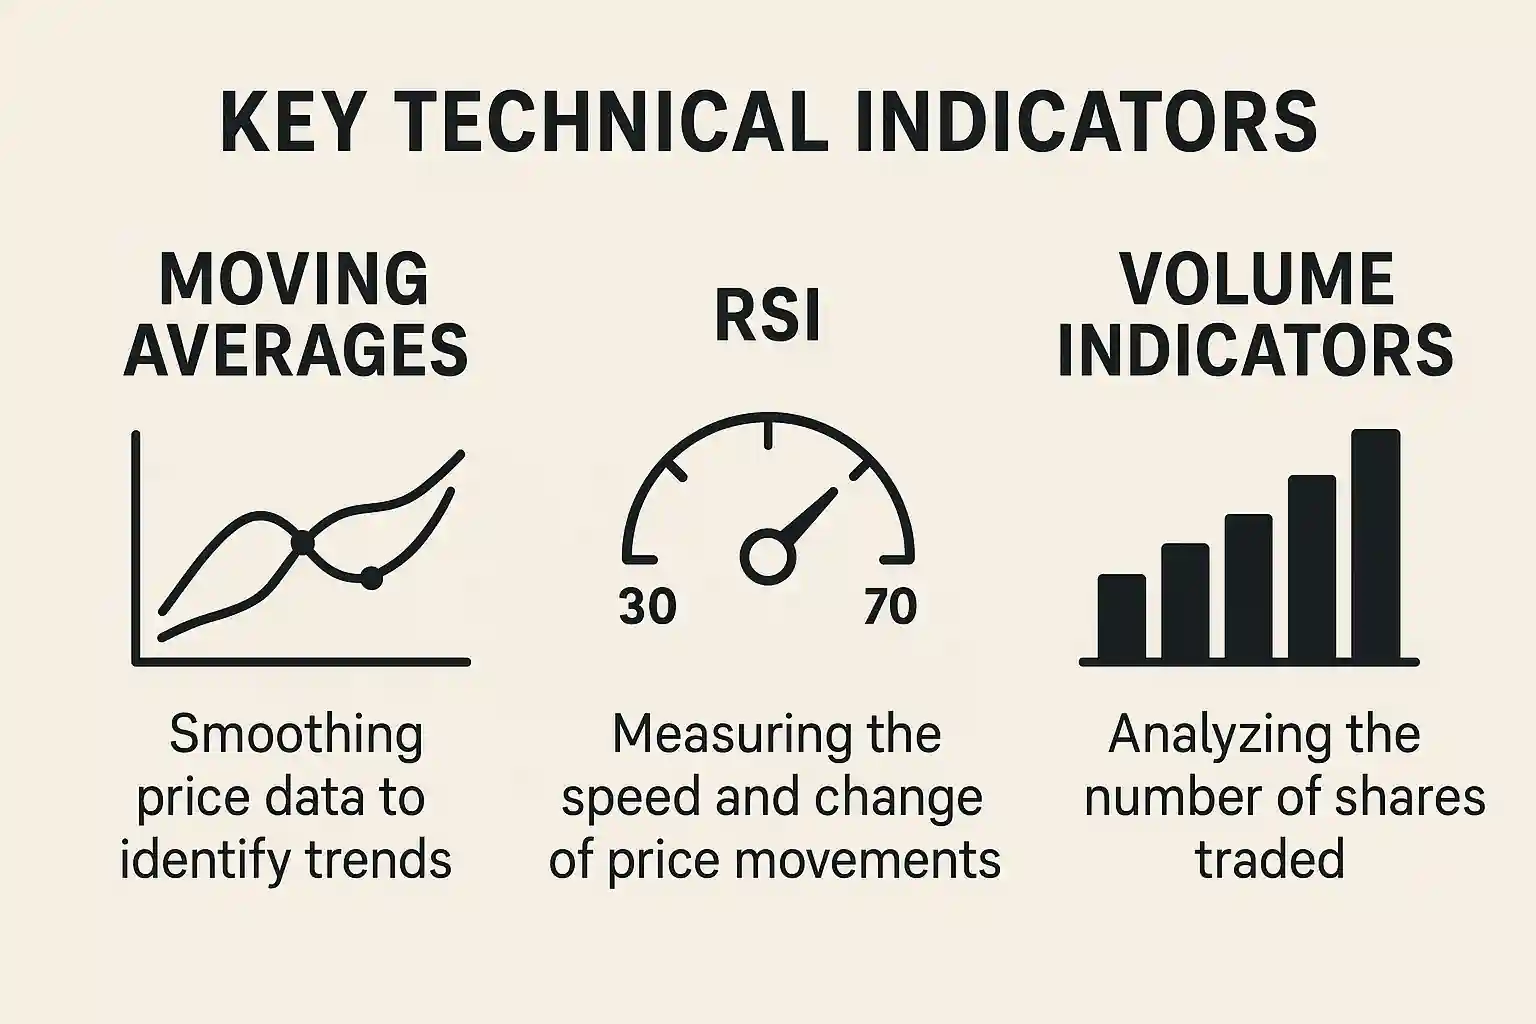
- Moving Averages: The crossover of short-term moving averages over long-term averages can signal a potential breakout. For instance, if the 20-day moving average crosses above the 50-day moving average for a stock, it may indicate an impending bullish breakout.
- Relative Strength Index (RSI): This momentum oscillator can help identify overbought or oversold conditions. If the RSI approaches 70 and then a breakout above the resistance occurs, it could signify a strong buying opportunity.
- Volume Indicators: A significant increase in volume during a breakout is a crucial sign of validity. If a stock price breaks out past resistance with exceptionally high volume, it suggests strong buyer interest, making it a more reliable signal for traders.
Recognizing Chart Patterns
Chart patterns can also hint at possible breakout scenarios. Some predominant patterns include:
- Triangles: Rising or falling triangles showcase price consolidation before a potential breakout. For instance, a rising triangle pattern in the stock of HDFC Bank may indicate a bullish breakout, and observing the price action can help traders prepare their entry.
- Flags and Pennants: These are short-term continuation patterns that often emerge after a strong price move. If a stock such as Tata Motors shows a flag pattern after a rapid rise, a breakout upwards is often anticipated.
- Head and Shoulders: This classic reversal pattern signals the end of an uptrend. A breakout below the neckline indicates a shift from bullish to bearish sentiment, allowing traders to act accordingly.
Case Study on Breakout Examples
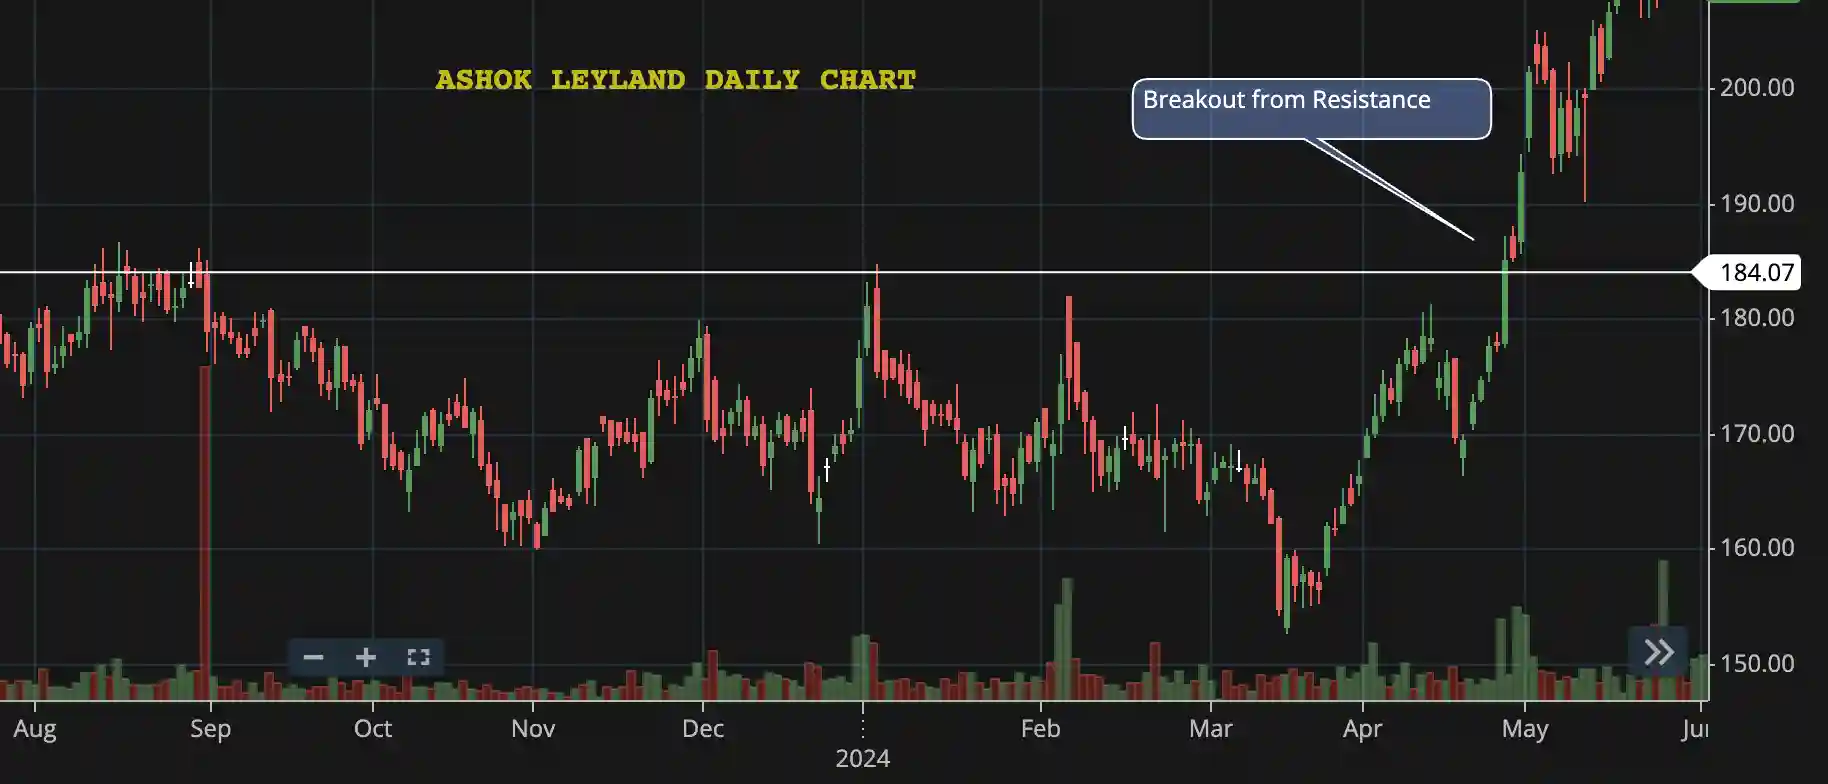
To provide real-world context, let’s explore recent breakout examples in the Indian stock market. Consider the stock of Ashok Leyland, which exhibited a confirmed bullish breakout when it moved above ₹184, backed with strong trading volume. Traders who identified this breakout pattern could have leveraged significant gains by entering near the breakout point while adhering to a well-structured risk management strategy.
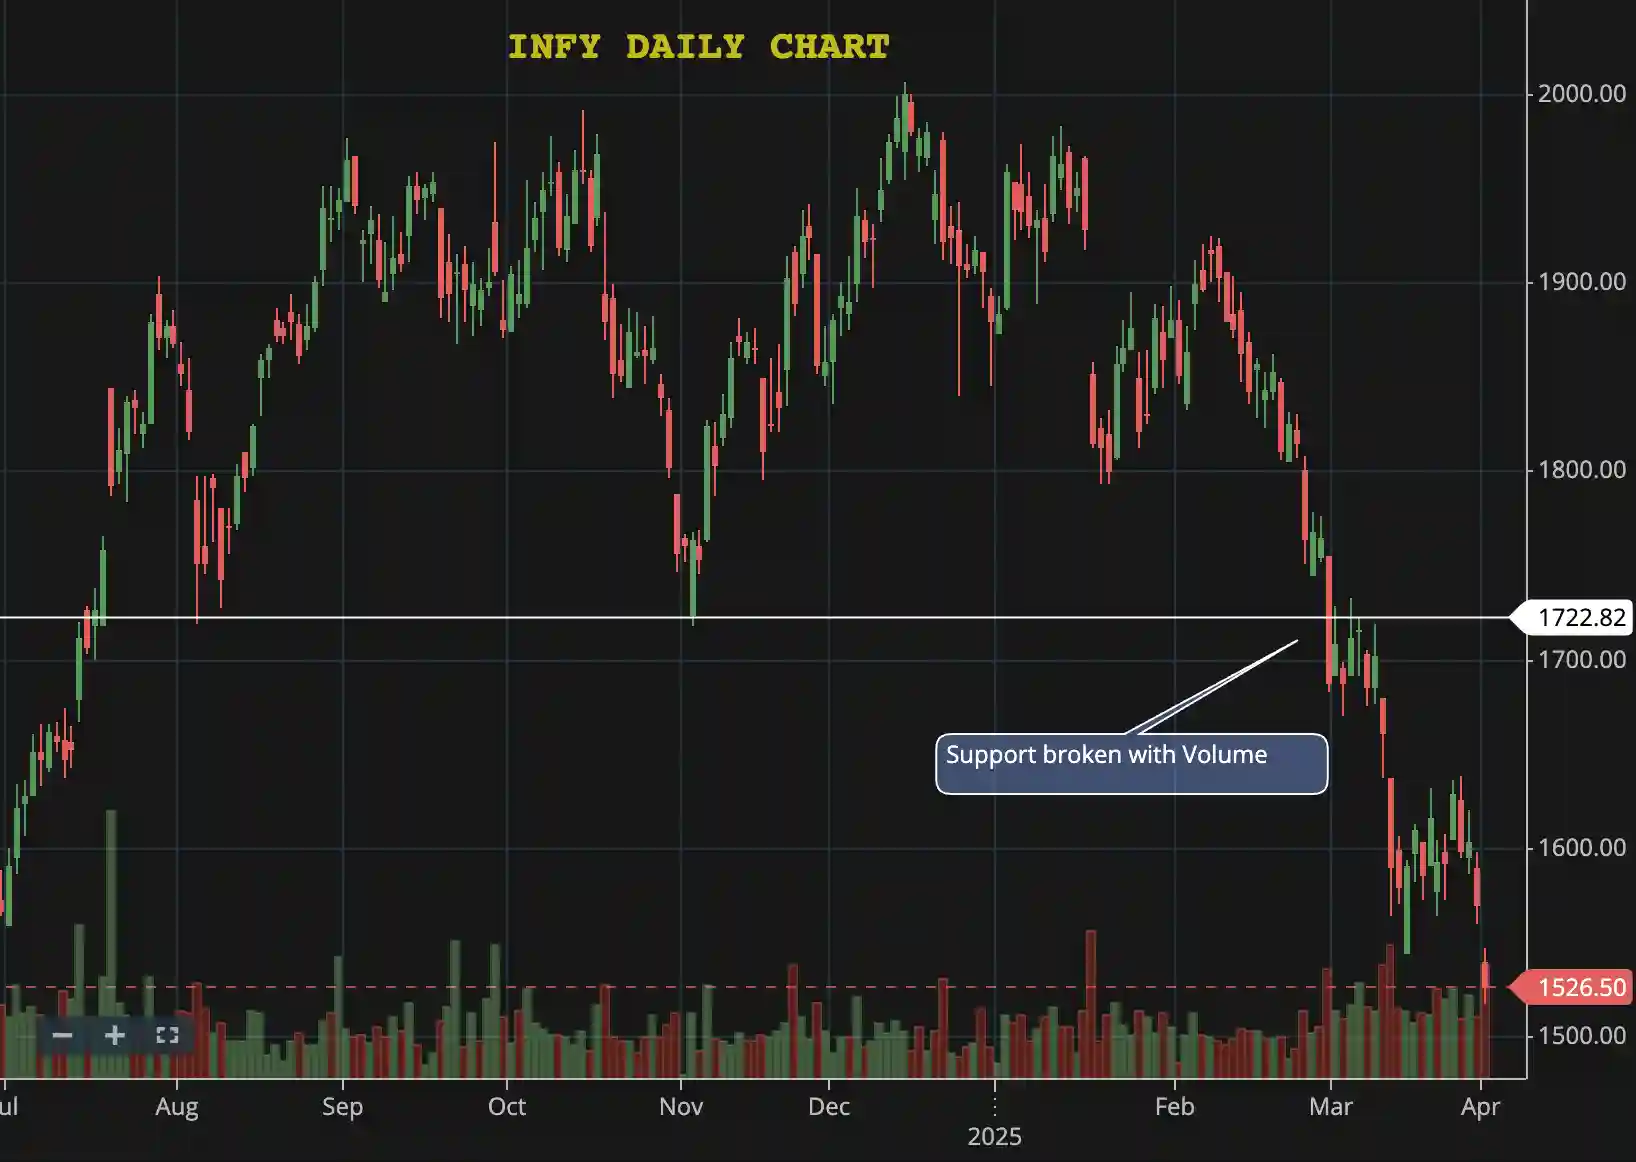
Another instance is the bearish breakout observed in the shares of Infosys. After failing to maintain above ₹1722, a swift decline below this level provided a clear sell signal, showcasing the importance of keeping an eye on support levels.
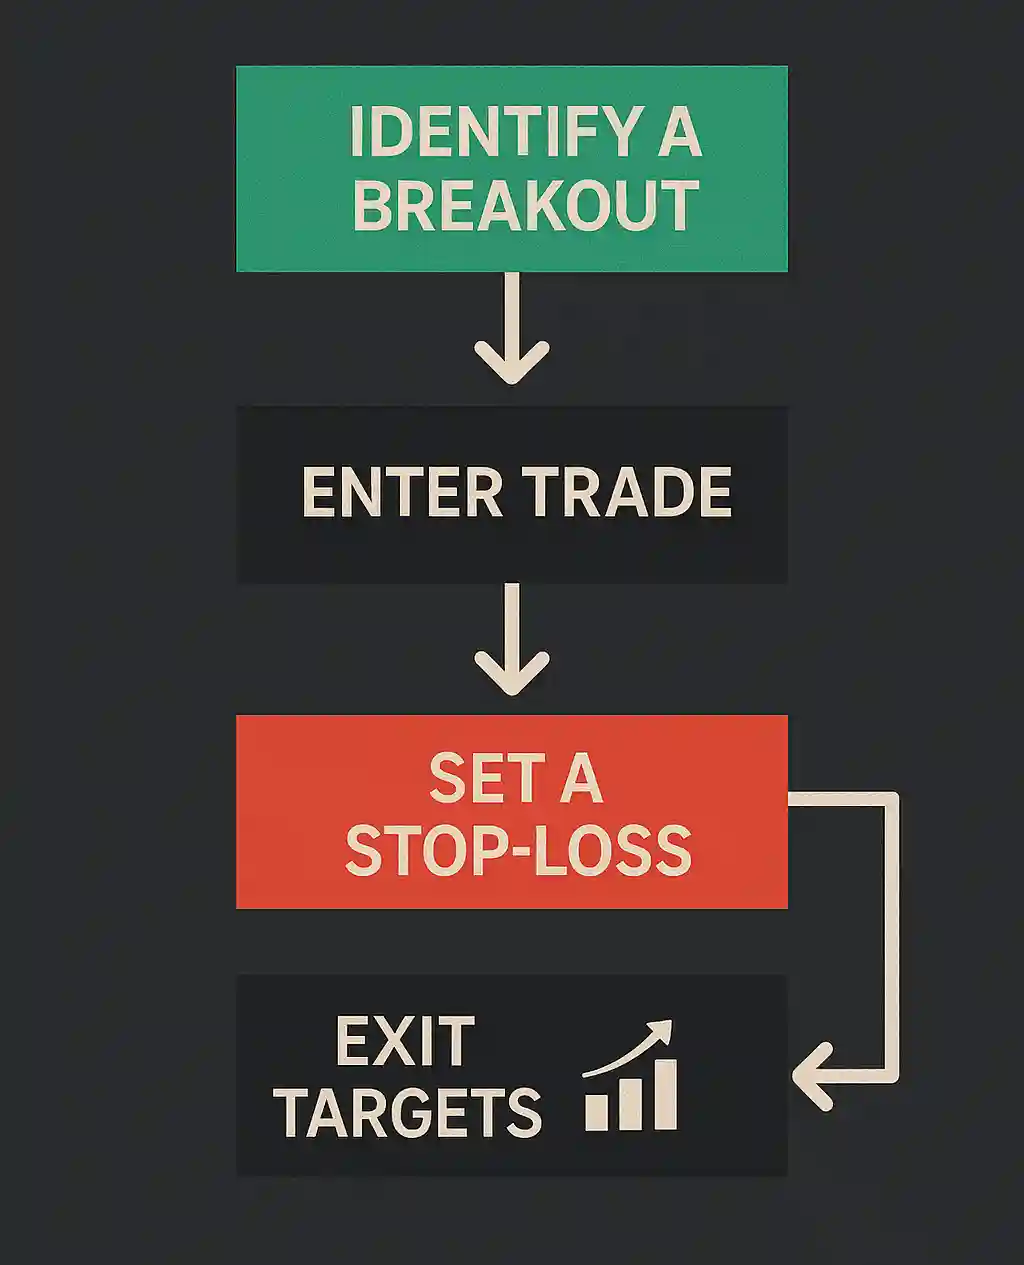
Strategies for Trading Breakouts
Once you’ve identified a potential breakout, developing a robust plan is vital for maximizing success.
Entry and Exit Strategies
Effective entry and exit points are crucial in breakout trading. Ideally, traders should enter a trade shortly after the breakout occurs, often a few points above the resistance level for bullish trades or below the support level for bearish trades.
Setting exit targets is equally important. A common strategy is to determine potential price targets based on previous price action, such as the height of the consolidation area prior to the breakout, then adding that distance to the breakout level. For instance, if the consolidation range of a stock was ₹100, and it breaks out at ₹1,000, you could set a target of ₹1,100.
Setting Stop Losses
Establishing stop-loss orders is vital in managing risks associated with breakout trading. A good practice is to set stop-loss orders slightly below the breakout level: for bullish trades, just beneath the breakout resistance; for bearish trades, just above the support. This tactic minimizes losses if the breakout fails and helps maintain emotional discipline.
If we take the previous example of Asian Paints, placing a stop-loss around ₹3,250 would have allowed traders to remain in the trade while guarding against significant losses, should the breakout fail.
Risk Management Techniques
Effective risk management encompasses more than just stop-loss orders. It also requires assessing the risk-reward ratio before entering any trade. A preferred risk-reward ratio for breakouts is 1:2 or 1:3, where the potential reward is at least double or triple the risk taken.
Another technique is adjusting position sizes according to your risk tolerance. If risking 1% of your total trading capital per trade, ensure that your position size aligns with this strategy. Using tools such as position sizing calculators can help streamline this process.
Common Pitfalls in Breakout Trading
Despite the potential rewards, breakout trading is not without its pitfalls. Here are some common mistakes to avoid:
- Chasing Breakouts: Trading on breakouts without proper confirmations can lead to impulsive decisions. Ensure that a breakout is backed by volume and price action before making a commitment.
- Ignoring Market Conditions: Broader market sentiment plays a significant role in breakouts. If the overall market trend is bearish, a bullish breakout could quickly reverse. Always consider market context when trading breakouts.
- Overtrading: The allure of quick gains can lead traders to overtrade, reducing their overall profitability. Stick to a well-defined strategy and resist the urge to jump into every breakout opportunity that appears.
- Lack of a Plan: Not having a structured plan for entry, exit, and risk management can lead to emotional trading decisions. Always adhere to your pre-defined trading strategy.
Utilizing Technology and Tools for Trading
In today’s digital age, numerous tools can facilitate effective breakout trading. From advanced charting software to automated trading systems, leveraging technology can enhance your trading experience.
Trading Platforms
Many stock trading platforms in India, such as Zerodha, Upstox, and 5paisa, offer robust features for traders, including real-time charts and indicators, allowing you to analyze breakouts effectively.
Stock Screeners
Using stock screeners can help identify stocks nearing breakout levels based on specific criteria you set. For instance, screeners can filter for stocks with low volatility consolidating around key support or resistance levels. Visit our article on Best Free Stock Screeners for Traders to explore the top tools that can help streamline this process.
Simulators and Backtesting Tools
Simulators allow traders to practice breakout strategies without financial risk. Additionally, backtesting tools can enable you to analyze historical price action, learning how specific breakout strategies would have performed in various market conditions. Learn more about the importance of backtesting in our article What is Backtesting and Why Is It Important?.
Conclusion and Key Takeaways
Trading breakouts in the Indian stock market can yield remarkable opportunities when approached with the right mindset and strategies. By understanding how to identify breakouts and develop a solid trading plan, including entry and exit strategies and risk management techniques, you can significantly improve your trading outcomes.
Remember, patience and disciplined execution are key in breakout trading. Stay informed about market trends, remain vigilant for breakout patterns, and utilize technological tools to streamline your trading process.
Ready to elevate your trading game? Subscribe to the Stockastic blog for more insights, strategies, and tips on mastering the art of breakout trading and other essential stock market concepts. Join our community of traders today and start making informed investment decisions!
A breakout occurs when the price of an asset moves above a defined resistance level or below a support level, leading to potential new trends. It often signals increased volatility and trading volume, which traders use to capitalize on market movements.
The two main types of breakouts are bullish and bearish. A bullish breakout occurs when the asset’s price rises above resistance, indicating potential upward momentum, whereas a bearish breakout happens when the price falls below support, signaling a possible downward trend.
Breakout opportunities can be identified using technical analysis and chart patterns. Key indicators like moving averages, the Relative Strength Index (RSI), and volume can signal potential breakouts, while chart patterns such as triangles and flags provide visual insights into price formations.
Traders should enter a position shortly after a confirmed breakout, slightly above the resistance level for bullish trades and below the support level for bearish trades. Exit targets can be set based on previous price action, while stop-loss orders should be placed strategically to minimize risk.
Risk management is vital in breakout trading. This includes setting stop-loss orders, evaluating the risk-reward ratio, and adjusting position sizes according to individual risk tolerance to mitigate potential losses and ensure long-term trading success.