
Investing in the stock market can feel like navigating a sea of numbers, jargon, and sometimes confusing headlines. The market constantly evolves with new policies, sectoral shifts, and emerging business models, making it crucial for investors, beginners and experts alike, to understand the true value of a company beyond just the stock price. Imagine you want to invest in a company but do not know where to start. Should you follow the buzz on social media or dig deeper? Fundamental analysis provides the compass to cut through noise and identify companies that can deliver consistent returns over time. This guide takes you on a step-by-step journey to evaluate companies with clarity, using simple explanations, real numbers, and relatable examples from the Indian stock market to build your investing confidence from scratch.
What is Fundamental Analysis?
Fundamental analysis is the study of a company’s business, financial health, and environment to estimate its intrinsic value. Unlike technical analysis, which looks primarily at price charts and trends, fundamental analysis delves deeper into the company’s qualitative and quantitative factors.
- Qualitative Factors: Business model, management quality, industry position.
- Quantitative Factors: Financial statements like income statements, balance sheets, and cash flow statements.
Why does this matter? While technical analysis tries to predict price movement in the short term, fundamental analysis seeks to assess whether the stock price reflects the real worth of the company. This makes it essential for medium and long-term investors.
Consider Warren Buffett, the global icon of value investing, who famously advises buying great businesses at fair prices. In the Indian context, investors like Rakesh Jhunjhunwala exemplified this principle with picks such as Titan Company, which grew from a small watchmaker into a dominant player in lifestyle brands thanks to strong fundamentals. Early investors in HDFC Bank and TCS also benefited handsomely by recognizing the companies’ expanding banking and IT services prowess respectively, long before they became market darlings.
Step-by-Step Guide to Evaluating a Company
Let’s walk through the fundamental evaluation process clearly and methodically.
1. Understanding the Business Model and Industry
The first step is to grasp how the company operates and generates revenue. Without this, numbers have no context. Lets look at how business model is understood with an example of two retail companies.
Example: DMart (Avenue Supermarts) vs. Future Retail
- DMart: A discount supermarket chain focused on low-cost daily essentials (FMCG, groceries, home needs) targeting price-sensitive consumers. Its model is built on controlled costs and bulk buying. Expansion is controlled and operates barebones, no-frills stores primarily in residential areas with high middle-class density
- Future Retail: Followed a hypermarket & departmental store model. Focused on expansion and scale – opening stores across Tier-1, 2, and 3 cities rapidly, relying on discount-led promotions and festive sales. Future Retail spread itself thin across multiple categories, eventually facing liquidity issues and high debt, leading to business uncertainty.

Many aspects related to the business model can be understood from the Business overview section of the Annual report of the company.
What to check in the Annual Report under Business Overview:
- Core products and services.
- Market share in industry.
- Revenue streams by segment or geography.
- Growth drivers and risks/opportunities.
2. Financial Statement Analysis
Examining actual numbers is where the rubber meets the road. The three key documents in the Financial statement of a company are: Income Statement, Balance sheet and Cash flow statement. Lets look at key numbers to look at in each.
a) Income Statement: Revenue and Profit Margins
- Revenue: This is the total money a company earns by selling its products or services, before accounting for any costs. Growth over years signals demand expansion.
- Net Profit Margins: After earning revenue, the company has to pay salaries, rent, interest, taxes, and other costs. What remains after paying all these expenses is the Net Profit. Net Profit Margin = (Net Profit ÷ Revenue) × 100. It tells you how much profit a company keeps out of every ₹100 it earns. Net profit margin reveals the efficiency and profitability of a company.
Example: Ultratech Cement has consistently shown strong in revenue while maintaining the Net Profit margins:
| Year | Revenue (Rs. Cr) | Net Profit (Rs. Cr) | Net Profit Margin (%) |
|---|---|---|---|
| FY2024 | 71,895 | 6,193 | 8.61 |
| FY2023 | 68,641 | 6,905 | 10.07 |
| FY2022 | 61,327 | 4,917 | 8.02 |
In stark contrast, Indian Cements has had declining revenues and inconsistent net profit margins, warning investors of financial issues.
| Year | Revenue (Rs. Cr) | Net Profit (Rs. Cr) | Net Profit Margin (%) |
|---|---|---|---|
| FY2024 | 4,942 | -227 | -4.59 |
| FY2023 | 5,749 | -125 | -2.17 |
| FY2022 | 4,373 | 87 | 1.99 |
b) Balance Sheet: Equity, Debt and Debt to Equity Ratio
- Equity: The money invested by owners or shareholders in the company (includes share capital + reserves). It’s the company’s own funds.
- Debt: Money borrowed from banks or investors that must be repaid with interest, regardless of profit. If utilised well, debt can help in strategic growth of the company.
- Debt-to-Equity Ratio: A measure of financial balance showing how much debt a company has compared to its equity. Lower = safer, higher = riskier.
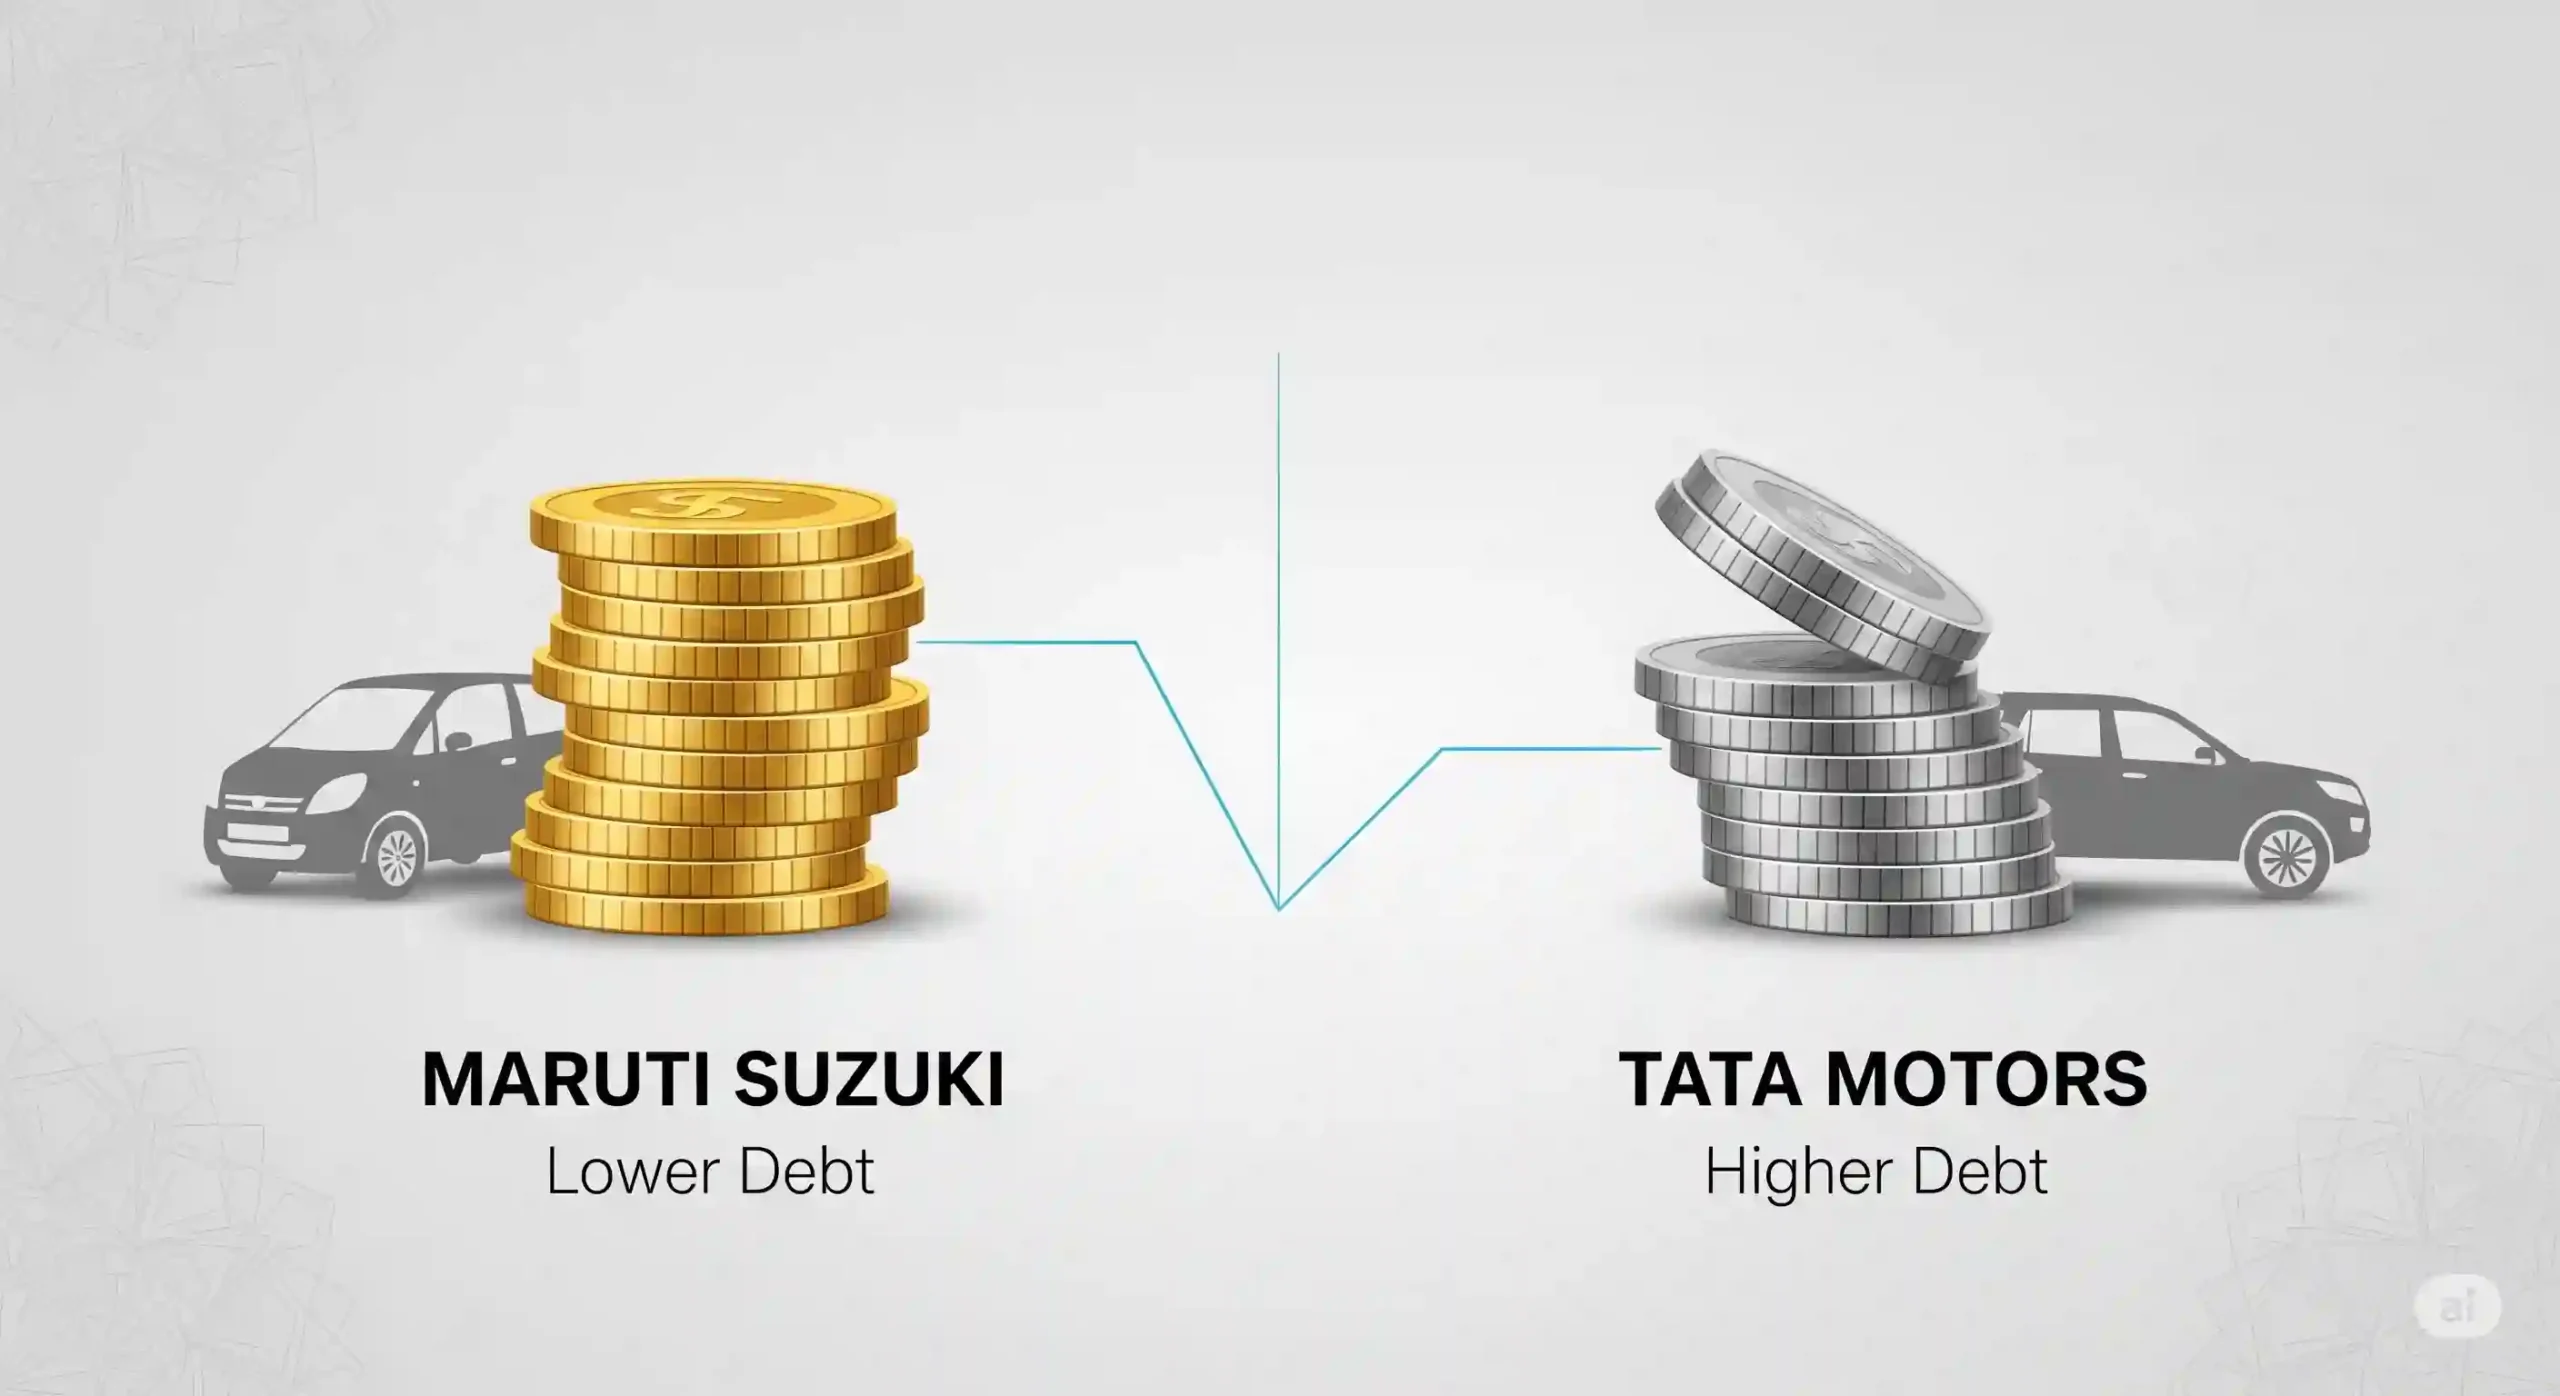
Example: Comparison of Maruti Suzuki and Tata Motors for FY 24-25
| Company | Debt (in ₹ crore) | Equity (in ₹ crore) | Debt to Equity Ratio |
|---|---|---|---|
| Maruti Suzuki India | 87 | 96,240 | 0.0009 |
| Tata Motors | 77,070 | 1,25,220 | 0.615 |
Maruti Suzuki has a very low Debt to Equity ratio, indicating it is a nearly debt-free company with a strong financial position. In contrast, Tata Motors carries a significant amount of debt, which is reflected in its higher Debt to Equity ratio. This suggests that Maruti Suzuki is in a better financial position in terms of managing its debt and relying more on its own equity for financing.
c) Cash Flow Statement: Operating Cash Flow (OCF)
Operating Cash Flow (OCF) shows how much cash the company generates from its core business operations (excluding financing and investing). Positive and consistently growing OCF means the company can sustain itself without relying on debt or equity funding.
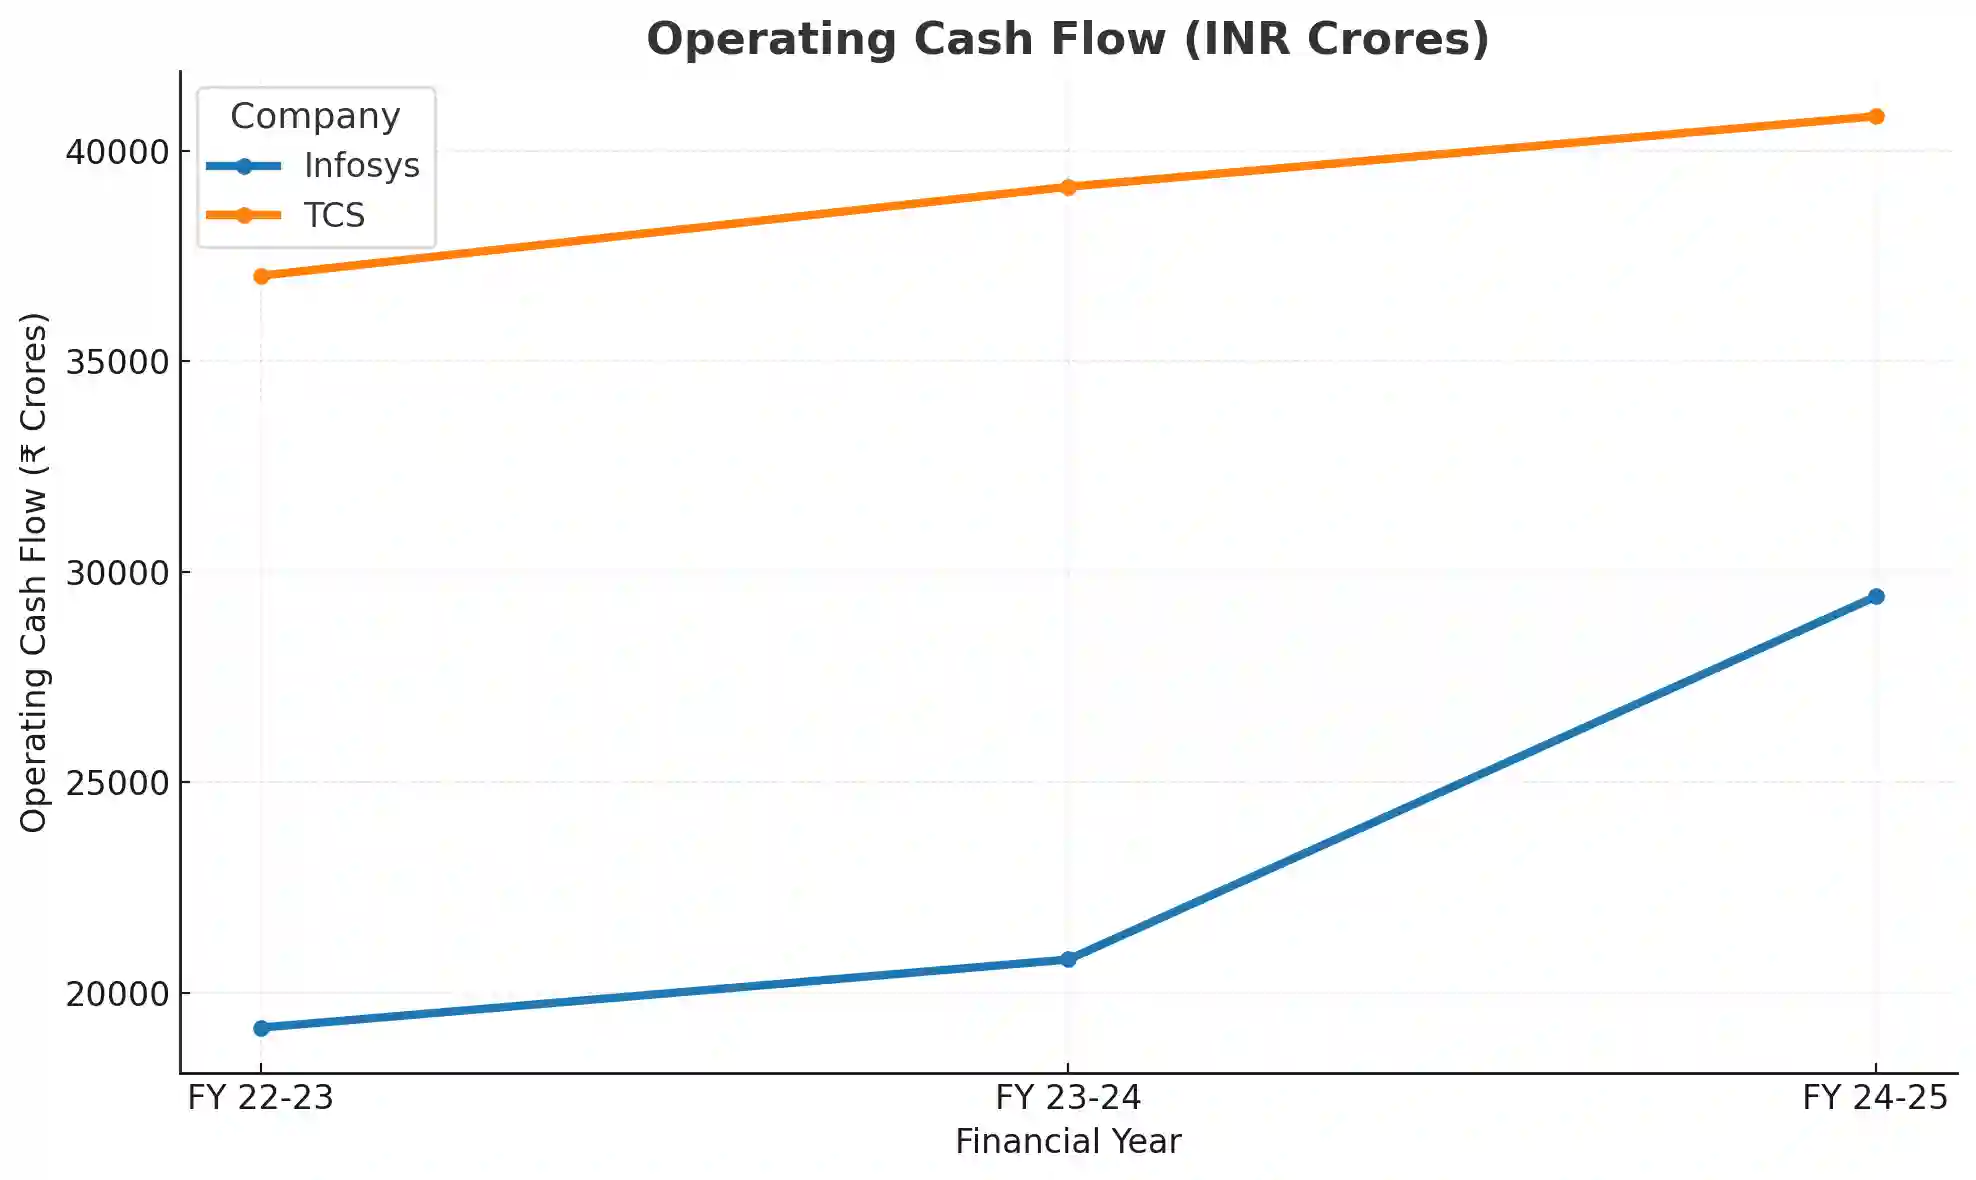
Example: OCF Comparison of Infoys and TCS over the years
| Financial Year | Infosys Operating Cash Flow (INR Crores) | TCS Operating Cash Flow (INR Crores) |
|---|---|---|
| FY 24-25 | 29,409 | 40,816 |
| FY 23-24 | 20,787 | 39,142 |
| FY 22-23 | 19,169 | 37,029 |
The consistently higher and growing operating cash flow of TCS compared to Infosys indicates stronger and more reliable cash generation capability. This suggests TCS has a larger operational scale, more robust business model, and potentially better management of working capital and expenses. Infosys shows good growth in cash flow in FY 24-25, signaling improving operational efficiency, but it still lags TCS in absolute terms.
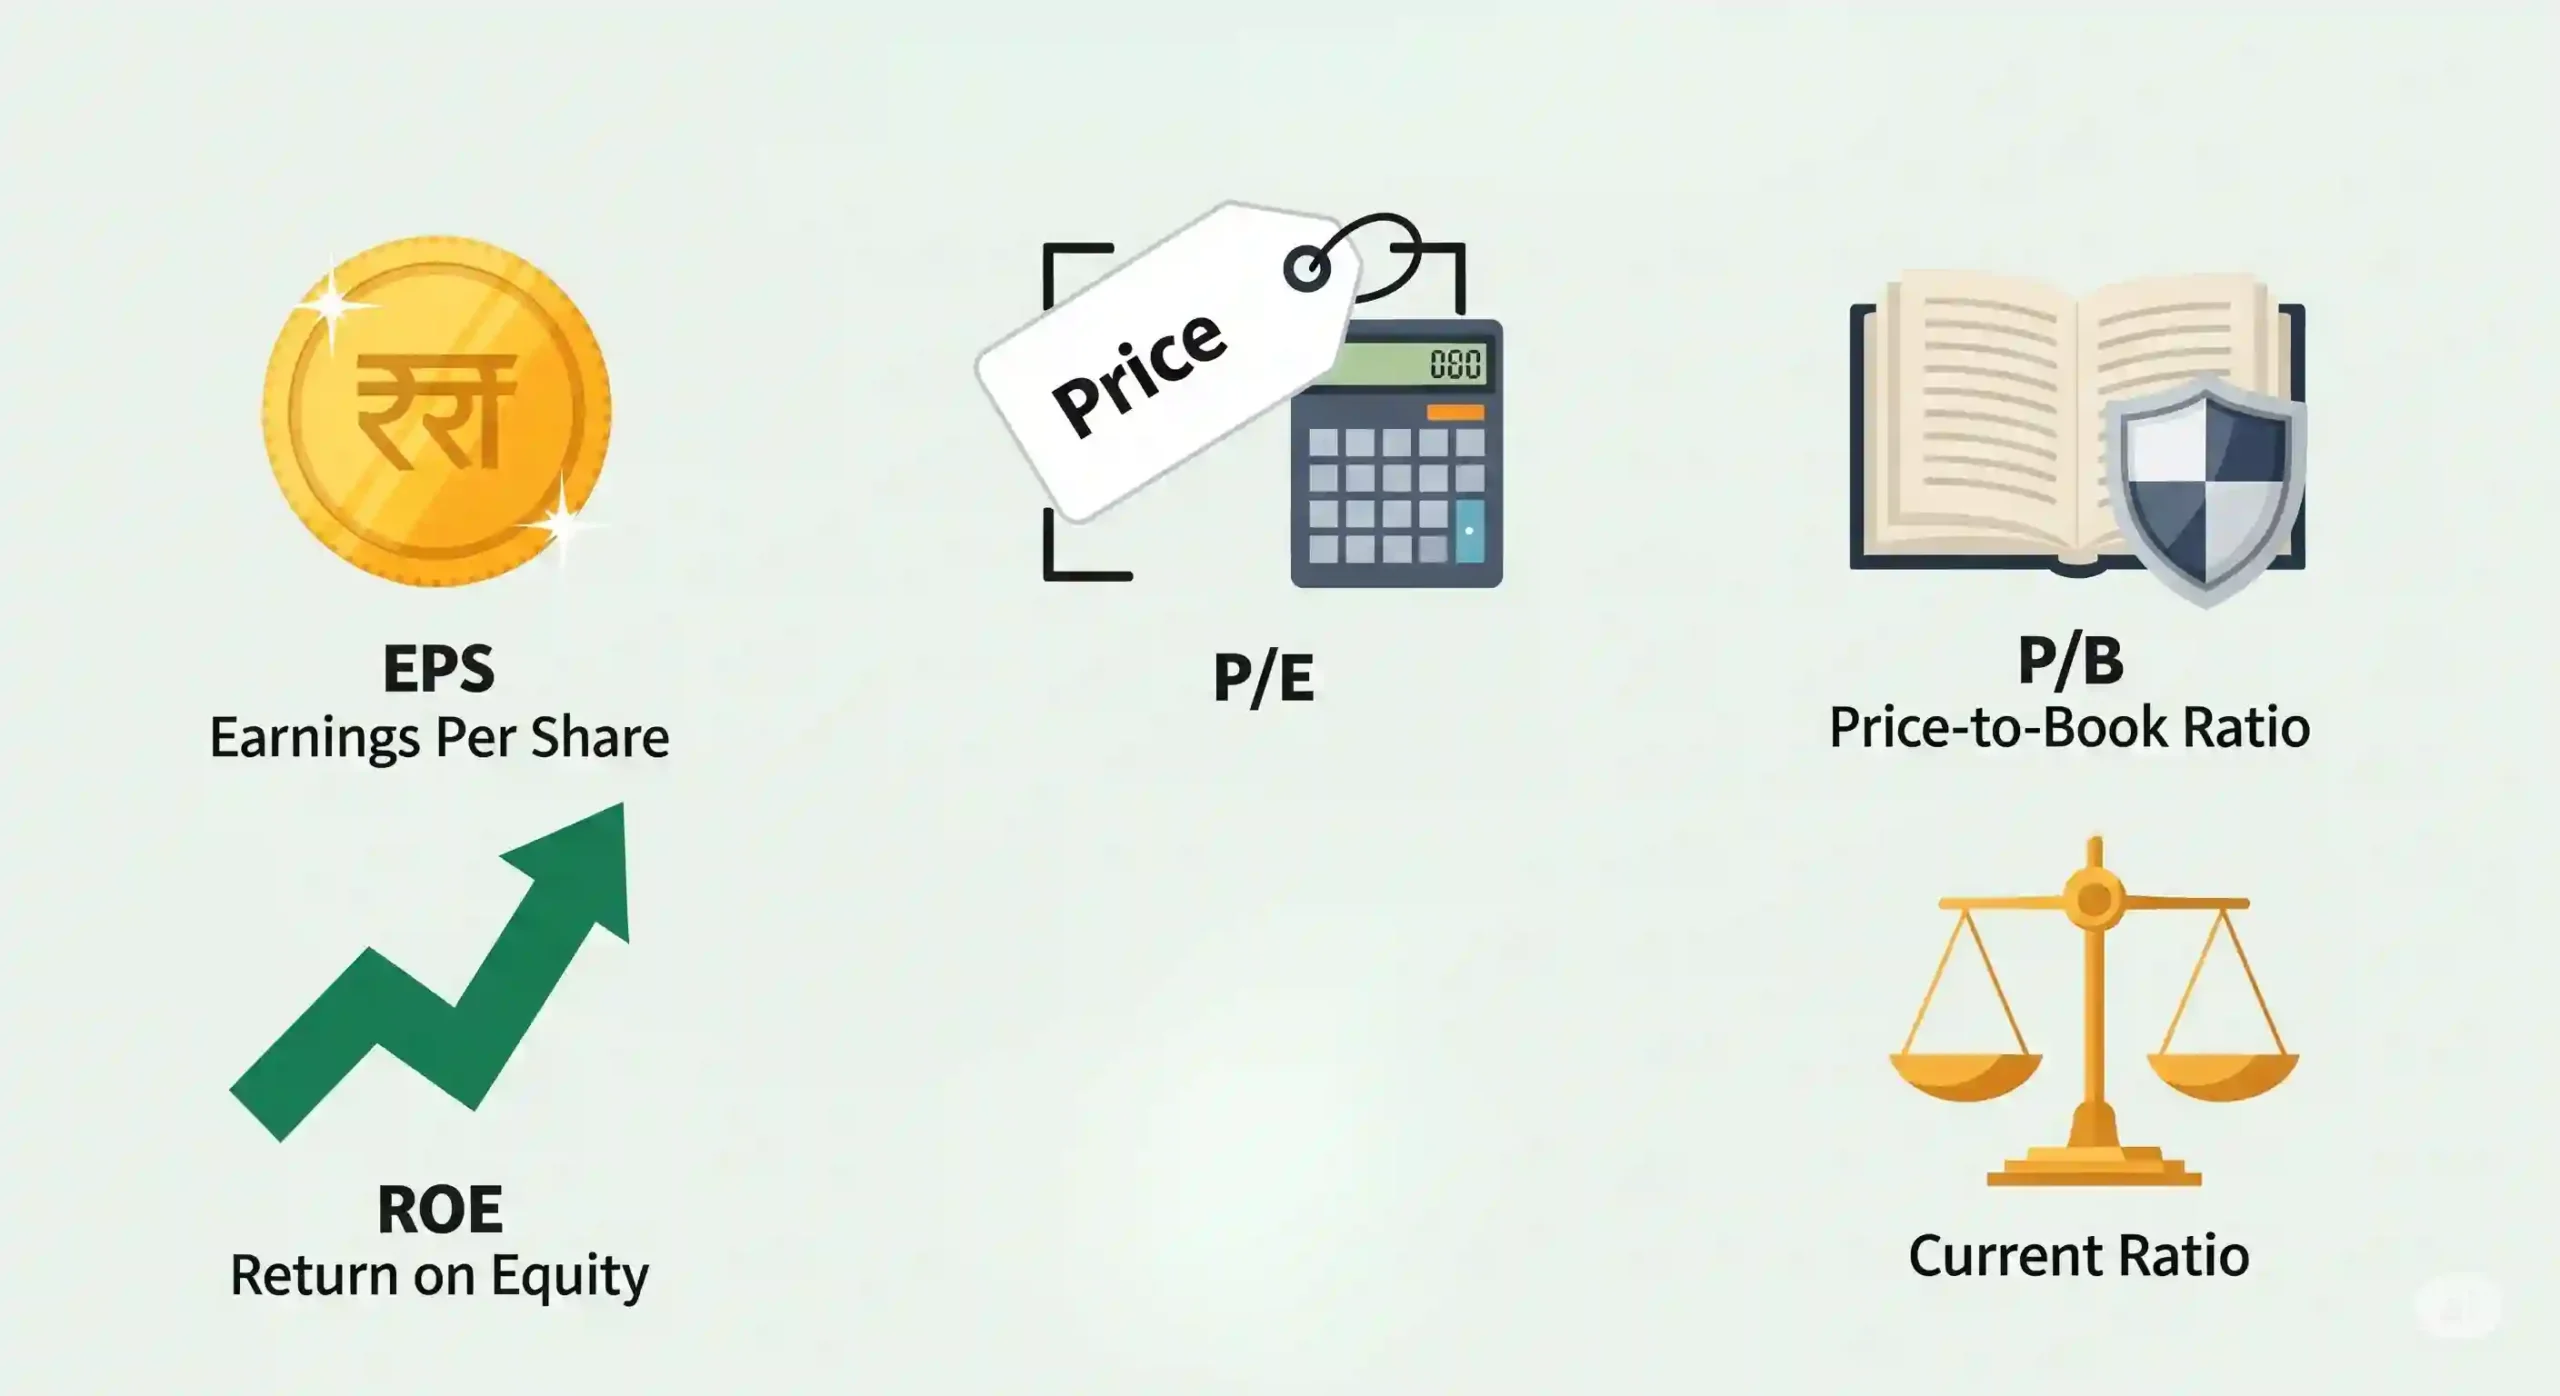
3. Key Fundamental Ratios You Must Know
To simplify analysis, you can use these popular fundamental ratios to analyse a company.
- Earnings per Share (EPS) – Shows the portion of profit allocated to each outstanding share.
Calculation: Net Profit ÷ Total Outstanding Shares
Usage: Compare EPS growth over time or across peers to judge profitability per share. - Price-to-Earnings (P/E) Ratio – Compares the stock’s market price with its earnings, showing how much investors are willing to pay for each unit of earnings.
Calculation: Share Price ÷ EPS
Usage: Used to assess if a stock is overvalued or undervalued compared to industry peers or its own history. - Price-to-Book (P/B) Ratio – Compares the market value of a company to its book value (net assets). A low P/B may indicate undervaluation, while a high P/B suggests strong investor confidence.
Calculation: Share Price ÷ Book Value per Share
Usage: Helpful for valuing asset-heavy companies like banks and real estate firms. - Return on Equity (ROE) – Measures how efficiently a company generates profit from shareholders’ equity. A consistently high ROE reflects effective use of capital.
Calculation: Net Profit ÷ Shareholders’ Equity
Usage: Investors track ROE to judge management’s effectiveness in generating returns. - Current Ratio – Indicates a company’s ability to pay its short-term obligations. A ratio above 1 shows good liquidity, but a very high ratio might suggest idle resources.
Calculation: Current Assets ÷ Current Liabilities
Usage: Commonly used to check short-term financial health and liquidity position.
More on these ratios in Top Fundamental Ratios and How to Use Them.
4. Qualitative Factors Affecting Company Value
So far we have looked at a lot of numbers, however numbers should be complemented with non-financial insights:
- Management Quality: How transparent and competent is leadership?
- Corporate Governance: Strong governance and adherence with best practicesbuilds confidence among investor.
- Promoter Holding: A drop in promoter stakes, like in ZEE Entertainment, can signal troubles.
- Industry Position & Competitive Advantage: Companies with strong brands, patents, technology, or distribution networks enjoy pricing power and long-term sustainability.
- Regulatory & Legal Environment: Some sectors (banking, telecom, pharma, energy) are heavily influenced by government policies. Favorable regulations boost growth, while adverse ones (tax hikes, bans) can hurt prospects.
- Innovation & Technology Adoption: Companies that innovate or adapt to new technologies remain competitive longer. Falling behind in digital transformation or R&D or AI can erode market share.
- Workforce & Company Culture: Skilled employees, low attrition, and a positive work culture contribute to efficiency and long-term performance.

For a deeper dive into Fundamental Analysis, check NSE’s Certificate Program in Fundamental Analysis.
Practical Walkthrough: Analyzing Deepak Nitrite
Step 1: Understand the business
Mid-sized specialty chemical manufacturer, Deepak Nitrite Limited is a leading Indian company manufacturing Phenol, Acetone, and Iso Propyl Alcohol for diverse industries, focusing on quality, reliability, and sustainability.
Step 2: Check Income Statement (Quarterly numbers: 1 Apr – 30 Jun 2025): Use the below values for reference only, many of them change based on the current share price.
- Revenue: ₹612 crore (-6.4% QoQ negative growth)
- Net Profit: ₹30 crore
- Net Profit Margin: ~5%
Step 3: Balance Sheet snapshot:
- Debt: ₹0 crore
- Equity: ₹27.28 crore
- Debt/Equity: 0
Step 4: Cash Flow
- Operating Cash Flow: Not available in Quarterly report
Step 5: Ratios
- EPS: 17.9 (Higher than previous quarter value – 3.95. Good sign)
- P/E: 102 (This suggests the stock is trading at 102 times its earnings, much more expensive than its sector average of 33. Not a good sign)
- P/B: 7.92 (Very high. Not a good sign. This means the stock trades at nearly 8 times its book value)
- ROE: 8.22% (Below average numbers for Top performing Indian equities)
- Current Ratio: 3.06 (Strong number. It means the company has more than enough short-term assets to cover short-term liabilities.)
Overall:
Deepak Nitrite remains a debt-free company with strong liquidity, but its current valuation (high P/E and P/B) appears expensive, especially given the recent decline in revenue and below-average ROE.
Conclusion and Action Steps
Fundamental analysis demystifies a company’s value, enabling you to invest confidently beyond market noise and hype. Doing your own research regularly—checking financials, tracking industry changes, and watching for red flags—can protect your capital and help identify opportunities.
Start with one company today. Go through its business model, financial numbers, and qualitative factors step-by-step. With every analysis, your investing skills will grow stronger. To stay updated and deepen your knowledge, subscribe to the Stockastic blog here and embark on a path to smarter Indian stock market investing.
Appendix: Quick Reference Checklist for Company Evaluation
- Understand business model and revenue streams.
- Check 3-5 year revenue and profit trends (growth/margins).
- Analyze debt to equity ratio and cash flow.
- Evaluate key ratios: EPS, P/E, ROE, P/B, current ratio.
- Review Qualitative factors like management quality and governance structure.
Fundamental analysis studies a company’s underlying business, financial health, and environment to determine its intrinsic value, focusing on qualitative and quantitative factors. In contrast, technical analysis primarily looks at price charts and trends to predict short-term price movements.
Understanding the business model provides context for the numbers, such as how the company generates revenue and what drives its growth. Without this, even detailed financial analysis can be misleading because numbers alone do not reveal how sustainable or scalable the business is.
The Income Statement is key for assessing profitability as it shows revenue, expenses, and net profit margins, revealing how efficiently a company converts sales into profit. Net profit margin, in particular, indicates how much profit is retained from each ₹100 of revenue.