
Technical analysis has become an indispensable part of how investors and traders operate in the Indian stock market. Whether examining golden cross vs death cross patterns or other chart formations, unlike fundamental analysis, which focuses on a company’s financial health, technical analysis scrutinizes price movements and chart patterns to predict future trends. At the heart of many technical strategies are moving averages, which smooth out price data to help spot prevailing trends.
Among the most closely watched moving average signals are the Golden Cross and Death Cross. These terms describe powerful moving average crossover events and are regarded as key indicators of bullish and bearish market trends, respectively. In India, these patterns have helped many investors identify trend reversals and potential momentum shifts in key stocks and indices like the Nifty 50 and Sensex. This article aims to demystify the golden cross and the death cross. This article will explain what they mean, how they are formed, and what implications they hold for investors. Using recent and historical examples from Indian stocks such as Reliance Industries, Adani Ports, and Tata Motors, we’ll explore how these signals work in practice. By the end, you will be better equipped to interpret these crossover signals and incorporate them meaningfully into your investment or trading strategies.
Understanding Moving Averages and Their Importance
A Moving Average (MA) is a widely used technical indicator that averages a stock’s price over a specific time, smoothing out fluctuations to reveal its direction or trend. There are two main types:
- Simple Moving Average (SMA): The arithmetic mean of prices over a set period. For instance, the 50-day SMA sums prices over the last 50 trading days and divides by 50.
- Exponential Moving Average (EMA): Gives more weight to recent prices, making it more responsive to new information.
Investors and traders rely heavily on moving averages to identify trend direction, spot potential reversals, and observe support or resistance levels. Two moving averages reign supreme in market analysis: the 50-day MA (shorter-term trend indicator) and the 200-day MA (longer-term trend gauge).
When these two averages interact, they create signals through crossover events that help predict shifts in the market momentum. A crossing of these moving averages can confirm whether an uptrend or downtrend is beginning or ending.
What is a Golden Cross?
Definition and Formation
A Golden Cross occurs when the short-term moving average, typically the 50-day SMA, crosses above the long-term moving average, generally the 200-day SMA. This crossover indicates that recent prices are rising faster than the longer-term average, signaling bullish momentum.
This pattern is considered a strong buy signal, suggesting the start of a sustained upward trend. The golden cross is widely regarded as a confirmation that buyer interest is increasing, and the stock or index may have entered a new growth phase.
Visually, on a candlestick chart, the 50-day MA line crosses up and over the 200-day MA line, often accompanied by rising price bars and increased trading volume, reinforcing the bullish sentiment.
Historical Examples from Indian Stocks
- Nifty 50 Index – May 2023: On 31 May 2023, the Nifty 50 saw a golden cross where the 50-day SMA crossed above the 200-day SMA. This preceded a significant rally over the next several quarters, which saw Nifty rising from 18500 levels to reach 26000 on 25 Sep 2024. This staggering total return of ~40% and a CAGR of 29% validates the golden cross’s bullish implications in the Indian market context.
- Reliance Industries – Late 2020: Reliance Industries experienced a golden cross in June 2020, just before a powerful price surge. The event coincided with positive market reactions to the successful Jio fundraising announcements, highlighting how the technical signal aligned with fundamental news to indicate bullish momentum.

Recent Golden Cross Events in 2024
- Adani Ports: In August 2023, Adani Ports & SEZ witnessed a golden cross event, which sparked optimism among traders. The bullish signal aligned with improved port traffic data, pushing share prices higher post-crossover.
- Zomato: On 14 July 2025, Zomatos’ stock (ETERNAL) showed a golden cross on its daily charts, buoyed by better than expected earnings results. It remains to be seen whether this will result in a long term rally for the stock or not
Interpretation Tips
Investors can use the golden cross as an indicator to consider initiating or adding to long positions. However, it’s advisable to seek confirmation with fundamental events like positive earnings or new investments and other technical indicators like volume spikes, Relative Strength Index (RSI), or MACD before acting solely on a golden cross signal. This helps mitigate the risk of false breakouts.
What is a Death Cross?
Definition and Formation
The Death Cross is the bearish counterpart to the golden cross. It occurs when the 50-day SMA crosses below the 200-day SMA, signaling weakening price momentum. This crossover is interpreted as a warning of prolonged downward trends or bearish market phases. Since it reflects short-term averages declining faster than the longer-term trend, it often triggers selling pressure among traders.
On candlestick charts, the 50-day MA slices downward beneath the 200-day MA, accompanied at times by falling prices and rising volumes on sell-offs.
Examples from Indian Stocks
- Tata Motors and others – October 2024: Many Indian stocks including Tata Motors, Reliance and Hindustan Unilever saw a death cross around October 2024, signalling a pause to the multi-year growth rally in the broader index as well. The investors found the Indian stock market overpriced due to global turmoil and lack-lustre earnings results.
- Paytm: Paytm experienced a “death cross” in January 2024, triggered by heightened volatility due to regulatory scrutiny and valuation concerns. The stock had already declined sharply, falling to around ₹700 amid panic selling. Following the death cross and further negative news about its operations, Paytm slid to the ₹350 range—a 50% correction. More recently, however, the stock has stabilized and was trading above ₹1,000 by the end of July 2025

Interpretation Tips
While death crosses often signal bearish trends, investors should be cautious because these can produce false signals, especially in sideways or choppy markets where prices oscillate without clear direction. Complementing death cross signals with volume analysis or other momentum indicators along with fundamental analysis, helps filter such cases.
Practical Applications & Limitations
How Traders and Investors Use These Signals
For swing traders, golden and death crosses provide entry and exit points for short- to medium-term trades. Long-term investors view these signals as part of a bigger picture, using the crossovers to confirm fundamental research and macroeconomic trends. They may avoid knee-jerk reactions to death crosses if their conviction on the company’s value remains intact.
Several studies highlight that combining moving average crossover strategies with other indicators improves success rates. Learn more about validating such strategies here: What is Backtesting and Why Is It Important?.
Key Limitations & Risks
Moving average crossovers inherently lag price action because they depend on historical data. This delay means:
- Signals may come after the initial move has started.
- The market may have already priced in much of the movement by the time the crossover appears.
Moreover, whipsaws—false breakouts and breakdowns—are common in volatile Indian stock markets. News events such as the RBI’s interest rate hike, trigger sharp but short-lived market reactions that render moving average crossovers temporarily unreliable.
Regulatory bodies caution investors against relying exclusively on technical indicators for trading decisions without considering fundamentals, especially in markets with sudden policy shifts.
Adapting Signals for Volatility
To increase reliability, pairing moving average crossovers with other indicators such as trading volume, RSI, or MACD is advisable. This multi-indicator approach helps confirm the strength of signals before taking action. Additionally, golden and death crosses tend to be more reliable for large-cap stocks with higher liquidity and smoother trends, compared to mid and small caps which may exhibit heightened price swings and false signals.
For traders looking to develop swing trading techniques incorporating these signals, check: Swing Trading Basics: A Step-by-Step Guide.
Golden Cross & Death Cross in Broader Market Perspective
At the index level, golden and death crosses hold significance:
- The Nifty 50 and Sensex regularly display these patterns signaling the onset or end of broader bull or bear markets.
- For example, the Nifty 50’s golden cross in 2023 confirmed a market uptrend after a prolonged correction, attracting inflows from domestic and foreign investors.
- Comparatively, the S&P 500 shows similar patterns but is often influenced by different macroeconomic and geopolitical factors, which can lead to timing differences in trend signals.
Sector rotation also relates closely to these crossovers. At different times in 2023-2024:
- The IT sector experienced golden crosses as digital adoption accelerated.
- The banking sector showed death crosses amid rate hike pressures before stabilizing.
- FMCG stocks demonstrated resilience with intermittent golden crosses reflecting steady demand.
Such patterns guide strategic asset allocation among sectors, helping investors anticipate shifts in market leadership.
Conclusion & Actionable Takeaways
The golden cross and death cross are powerful moving average crossover signals, widely used by investors and traders in the Indian stock market to identify bullish and bearish trends. Historical and recent examples from stocks like Reliance Industries, Adani Ports, Maruti Suzuki, and more importantly Index demonstrate their practical importance. However, it’s essential to exercise caution: these patterns are lagging indicators and prone to false signals, especially during volatile periods or sideways markets. Combining them with other technical tools and fundamental analysis is necessary for well-rounded decision-making.
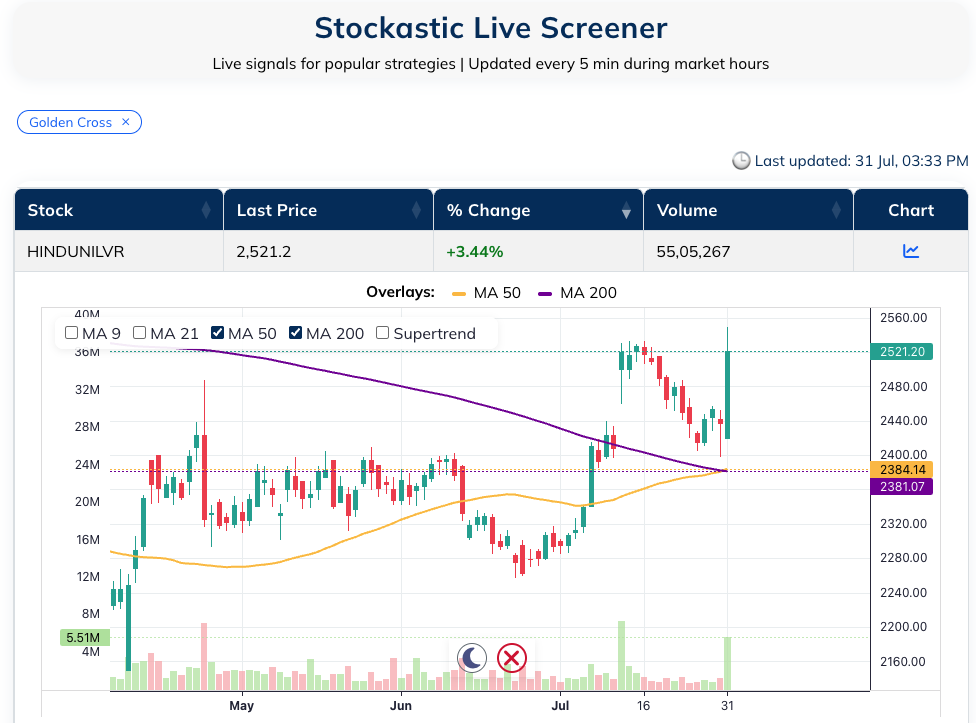
For investors keen on exploring Indian stocks exhibiting these crossover signals, consider utilizing specialized tools like the Stock Screener for quickly filtering stocks based on live technical signals.
To deepen your understanding and develop confidence in applying such technical analysis concepts, subscribe to the Stockastic blog and stay updated with actionable insights tailored for Indian markets.
A Golden Cross occurs when the 50-day moving average crosses above the 200-day moving average, signaling a bullish trend. Conversely, a Death Cross happens when the 50-day SMA crosses below the 200-day SMA, indicating a bearish trend. These patterns reflect changes in market momentum and investor sentiment.
While Golden and Death Crosses are widely used technical signals, they are lagging indicators and can produce false signals, especially in volatile or sideways markets. It’s advisable to confirm them with other indicators like volume, RSI, or MACD and consider fundamental analysis for better decision-making.
These signals are versatile and can be used for both short-term swing trading and long-term investing. Traders often view them as entry or exit points, whereas long-term investors may use them to confirm trend reversals aligned with fundamental outlooks.
Yes, Golden and Death Crosses tend to be more reliable in large-cap stocks due to higher liquidity and smoother price trends, reducing the likelihood of false signals caused by volatility in smaller-cap stocks