
IntroductionStock Analysis in the Indian Stock Market is essential for making informed investment decisions and optimizing returns.
Investing in stocks can be a fraught experience for beginners and even intermediate investors. The importance of stock analysis cannot be overstated—it is essential for making informed investment decisions and maximizing returns. Given that the Indian stock market has its unique characteristics, understanding these aspects is pivotal for aspiring investors. This guide aims to empower you with practical knowledge, from the nuances of financial statements to the evaluation of industry positions, ensuring that you are well-equipped to navigate the complexities of stock analysis.
I. Understanding Financial Statements
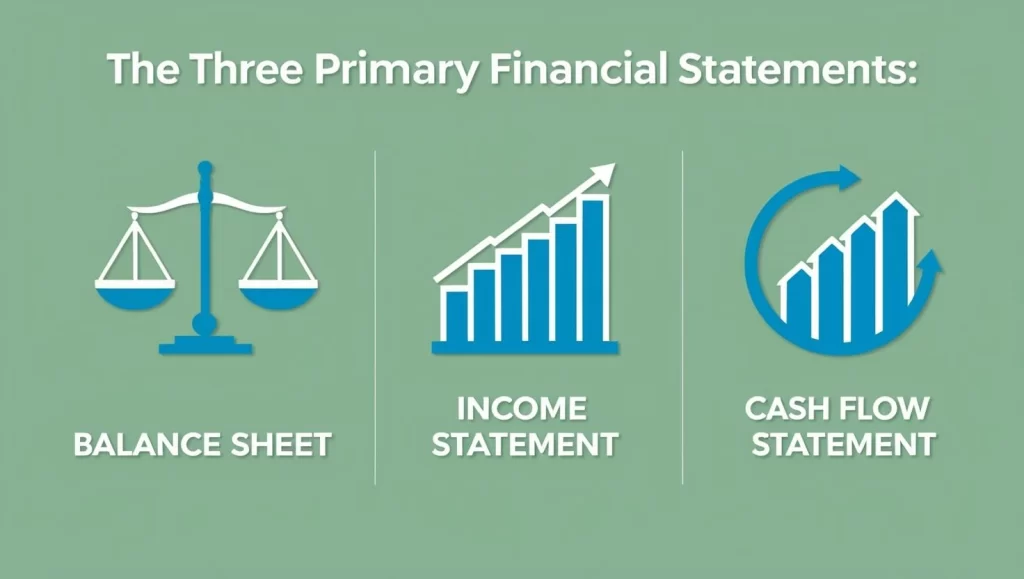
Before diving deep into stock analysis, it’s crucial to familiarize yourself with the three primary financial statements: the balance sheet, income statement, and cash flow statement. These documents provide essential insights into a company’s profitability, liquidity, and overall financial health.
Balance Sheet
A balance sheet gives a snapshot of a company’s assets, liabilities, and shareholders’ equity at a specific point in time. Key metrics include:
- Assets: What the company owns.
- Liabilities: What the company owes.
- Shareholders’ Equity: The net assets available to shareholders.
Income Statement
The income statement focuses on the company’s revenue, expenses, and profits over a period. Important figures include:
- Revenue: Total sales generated.
- Net Income: Profit after all expenses, taxes, and costs have been deducted.
Cash Flow Statement
This statement provides insights into how money enters and exits the business. Key components are:
- Operating Activities: Cash generated from normal business operations.
- Investing Activities: Cash spent on investments or acquired assets.
- Financing Activities: Cash from receiving or repaying loans and equity.
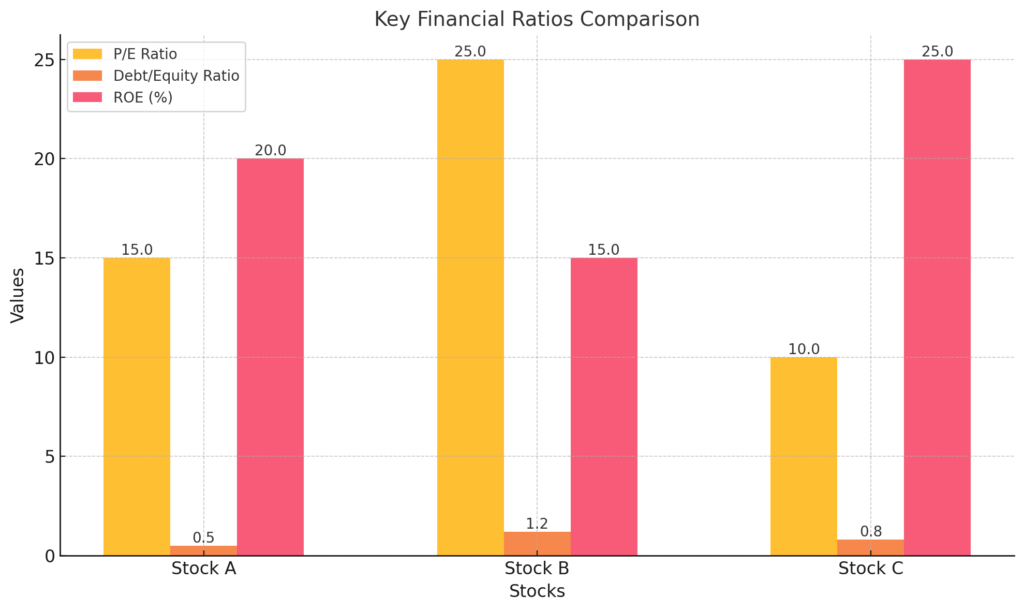
Key Financial Ratios
To further analyze a company’s financial health, consider the following ratios:
- P/E Ratio (Price-to-Earnings): This ratio indicates how much investors are willing to pay per rupee of earnings—helpful in valuing a company’s stock.
- Debt/Equity Ratio: A high ratio suggests a more highly leveraged company, indicating financial risk.
- Return on Equity (ROE): This reveals how effectively a company uses shareholders’ equity to generate profits.
Example: TCS Stock Analysis
For instance, let’s analyze TCS (Tata Consultancy Services). As of 31 Dec 2024:
- The P/E ratio stands at 30.8, which is reasonable for a tech company in India and close to industry P/E of 32.4 .
- The Debt/Equity ratio is at 0.09, indicating low financial risk.
- TCS boasts an impressive ROE of 51.5%, showcasing their efficiency in generating profit from shareholders’ equity.
Understanding the basics of financial statements and key ratios enables you to scrutinize and compare companies effectively.
II. Analyzing Market Trends
With a solid grasp on financial statements, the next step involves understanding market trends. Macroeconomic indicators like GDP growth, inflation rates, and interest rates can significantly impact stock prices.
Identifying Macroeconomic Indicators
- GDP Growth Rate: A growing economy often leads to higher stock returns.
- Inflation Rates: Moderate inflation can positively affect stock prices, while hyperinflation might deter investment.
- Interest Rates: Higher rates typically lead to lower stock prices as businesses face higher borrowing costs.
Basics of Technical Analysis
Understanding chart patterns is crucial. Key indicators include:
- Moving Averages: Used to identify trends over specific periods.
- Support and Resistance Levels: Price points indicating market sentiment.
Example: Recent Trends in Nifty 50
For example, monitoring Nifty 50 trends, one can see that following the robust rally from the beginning of 2024 till Sep 2024, there has been a dip due to economic uncertainty. Recognizing such patterns helps you time your entry and exit in the market.

III. Evaluating Industry Position
Beyond individual stocks, evaluating the industry in which a company operates is essential for effective stock analysis.
Assessing Competitive Landscape
Consider the market share and position of a business within its sector. A company’s ability to differentiate itself plays a crucial role in its long-term success.
SWOT Analysis
Conducting a SWOT analysis (Strengths, Weaknesses, Opportunities, Threats) provides clarity over the competitive landscape.
Example: Sectoral Analysis of the Indian IT Industry
Taking a look at the Indian IT industry, we find that:
- Strengths: A large talent pool and global demand.
- Weaknesses: Dependence on US and UK markets.
- Opportunities: Growing demand for digital transformation.
- Threats: Rising competition from other emerging markets.
Focusing on these factors underlines the potential investment opportunities within the sector.
IV. Assessing Management and Corporate Governance
The quality of a company’s management and its corporate governance standards can significantly impact its performance.
Importance of Management Quality
A strong management team with a proven track record is often a predictor of future success. Key attributes include:
- Vision and strategy: Clarity in long-term planning.
- Integrity: Ethical practices and transparent operations.
Example: A Case Study on HDFC Bank
HDFC Bank is a notable example of robust management. It has consistently displayed strong governance practices, resulting in a loyal customer base and consistent growth, making it an appealing investment for those looking into banking stocks.
V. Risk Assessment and Management
Every investment comes with inherent risks. Hence, understanding and managing risks is vital for stock analysis.
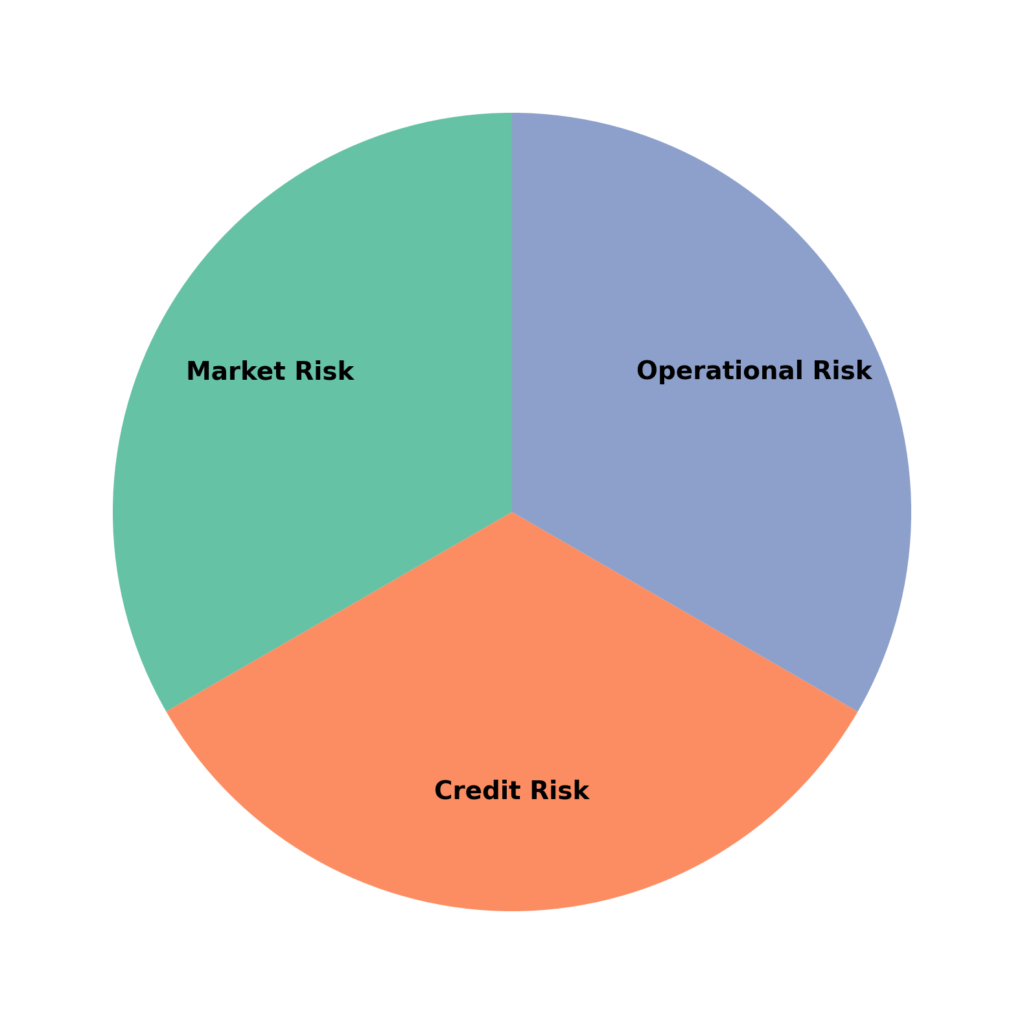
Types of Risks
- Market Risk: The potential for losses due to market-wide factors.
- Credit Risk: The likelihood of a company’s default on its obligations.
- Operational Risk: Failures in internal processes or systems.
Tools for Risk Management
Investors can utilize various tools for mitigating risk:
- Diversification: Spreading investments across sectors to reduce exposure to a single sector risk.
- Stop-Loss Orders: Setting predefined sell orders to minimize losses.
Example:
Investing in stocks with diversified stocks such as Reliance is less risky. Reliance Industries has expanded beyond refineries into various sectors, including telecom and retail, mitigating risks associated with any single business.
Conclusion
This guide has taken you through a comprehensive journey of stock analysis. By understanding financial statements, analyzing market trends, evaluating industry positions, considering management quality, and assessing risks, you would be better prepared to make informed investment decisions in the Indian stock market. Remember, the key to successful investing lies in continuous learning and adaptation; the markets are ever-evolving, and being proactive can make all the difference.
We invite you to subscribe to our blog for regular insights and updates on the Indian stock market. Share this guide with fellow investors eager to improve their stock analysis skills and knowledge.
FAQs
The three main financial statements to examine are:
Balance Sheet: Provides a snapshot of a company’s assets, liabilities, and shareholders’ equity at a specific point in time.
Income Statement: Details the company’s revenues, expenses, and profits over a particular period.
Cash Flow Statement: Shows the inflows and outflows of cash, highlighting operational efficiency and liquidity.
These statements collectively offer insights into a company’s financial health and performance.
Key financial ratios include:
Price-to-Earnings (P/E) Ratio: Indicates how much investors are willing to pay per unit of earnings.
Debt-to-Equity (D/E) Ratio: Measures the company’s financial leverage by comparing its total liabilities to shareholders’ equity.
Return on Equity (ROE): Assesses a company’s profitability by revealing how much profit it generates with the shareholders’ equity.
These ratios help investors compare companies within the same industry and assess their relative value and financial stability.
Macroeconomic indicators such as GDP growth, inflation rates, and interest rates can significantly impact a company’s performance and, consequently, its stock price. For instance, higher GDP growth may signal a robust economy, potentially boosting corporate earnings, while rising interest rates could increase borrowing costs, affecting profitability.